We are open to managing your modeling projects. Up to now we have completed a
number of modeling commissions, the most important of which are presented in
the summaries below.
Project 1
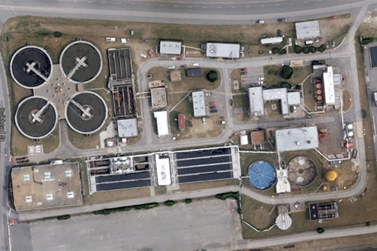
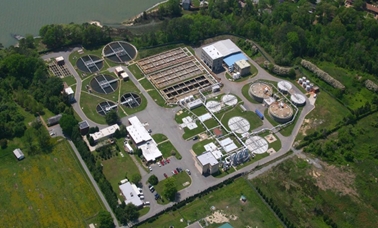
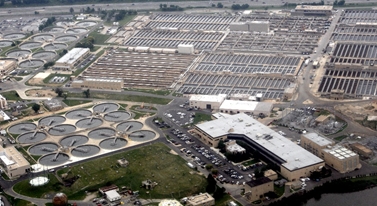
Background: The plant has primary treatment with
occasional ferric addition, followed by a Five-Stage Bardenpho process
configuration with carbon addition in the post anoxic tank. The plant also
has a sidestream treatment for treating scrubber water generated from the
incinerators.
Size: 34,000 m3/d, 74,000 PE
Modeling objectives and outcome:
- Perform solids mass balance around primary and secondary
clarifiers
A significant mass balance error was identified
in the primary clarifier solids data and corrected in the model. For
secondary clarifiers, the coefficient of hindered settling was
drastically reduced to 0.05 L/g to reproduce the solids in the underflow
and coefficient of flocculant settling was increased to 20 L/g. This was
to simulate effluent TSS which suggested fast settling solids.
- Model the aeration capacity of the plant
The specific
standard oxygen transfer efficiency of about 39% was identified from the
model which was comparable to the design.
- Confirm plant’s current carbon dosing strategy and impact of
dissolved oxygen bleeding
An important lesson learned was
the amount of methanol oxidized due to oxygen bleeding through the weir
and surface intrusion was predicted by the model to be about 21%. This
is significant amount of carbon required towards driving the oxygen
concentrations down to achieve acceptable denitrification conditions. A
proposal was set to identify appropriate strategy to reduce oxidation of
methanol. This could be a potential for cost saving for the plant.
- Determine impact of tanks out of services on the plant’s bio-P
performance
Multiple scenario analysis was performed to
simulate the impact on bio-P performance. The high nitrate concentration
of 1.5 to 3 mgN/L in the primary clarifier effluent due to high recycle
from the sidestream treatment facility was identified to be the possible
reason for reduction on bio-P performance.
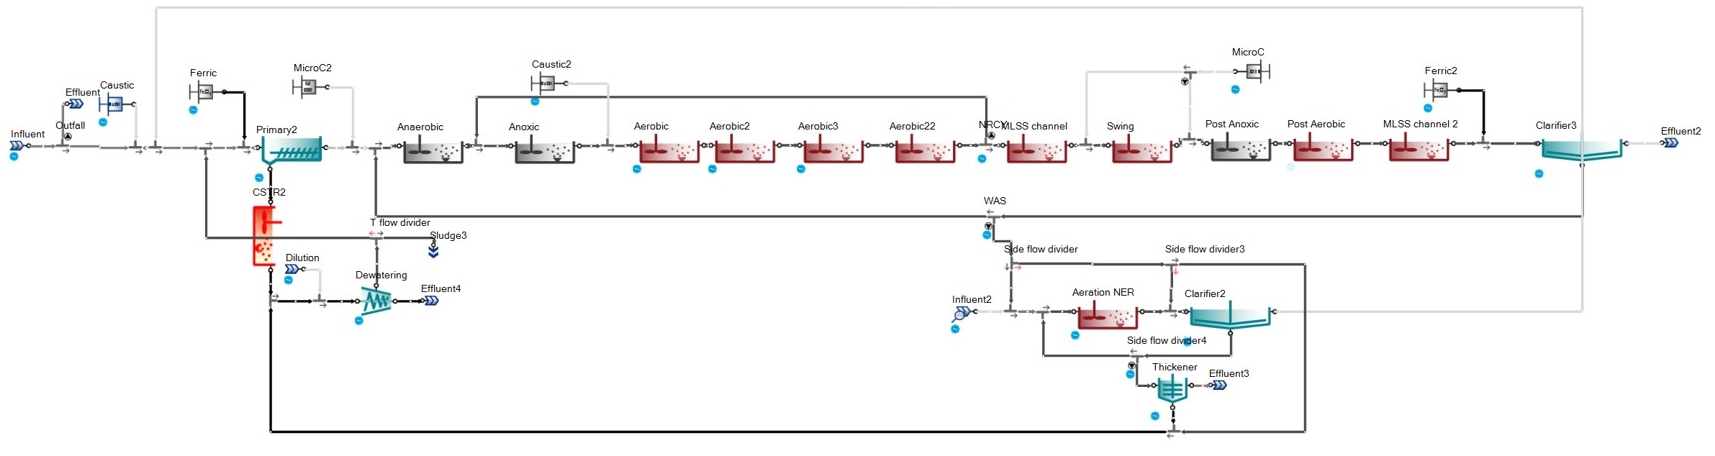
Figure 1.1. WWTP model configuration.
Project 2
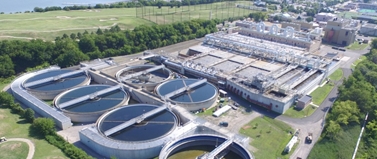
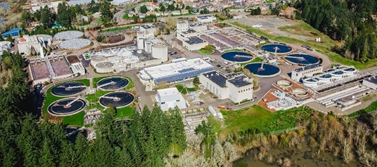
Background: The plant initially had a 3-stage
biological treatment process, which provided bio-P and seasonal
nitrification and denitrification. This was upgraded to a 5-stage process
that provides year-round nite/denite, while maintaining bio-P performance as
well.
Size: 92,000 m3/d, 300,000 PE
Modeling objectives and outcome:
- Reproduce current plant performance after the upgrade and investigate
seasonal variation in bio-P performance
The modeled
delivered successfully reproduced the solids and nutrient removal
performance. The seasonal temperature changes from 13 °C to the 35 °C,
which hampers Bio-P performance, especially during the summer season.
The poor bio-P performance during the summer is attributed to shift in
the biomass population. Using the advanced bio-P model in SUMO we can
identify mitigation strategies to prevent poor bio-P performance.
- Optimizing air demand and carbon dose in post anoxic/aerobic zones
while maintaining less than 5 mg N/L of effluent total nitrogen
concentration
Two control logics were implemented and
evaluated for operational optimization. Ammonia based aeration control
and feed forward methanol addition control were implemented and multiple
scenario analysis was performed with different ammonia and nitrate
setpoints to identify minimum aeration demand and carbon requirements.
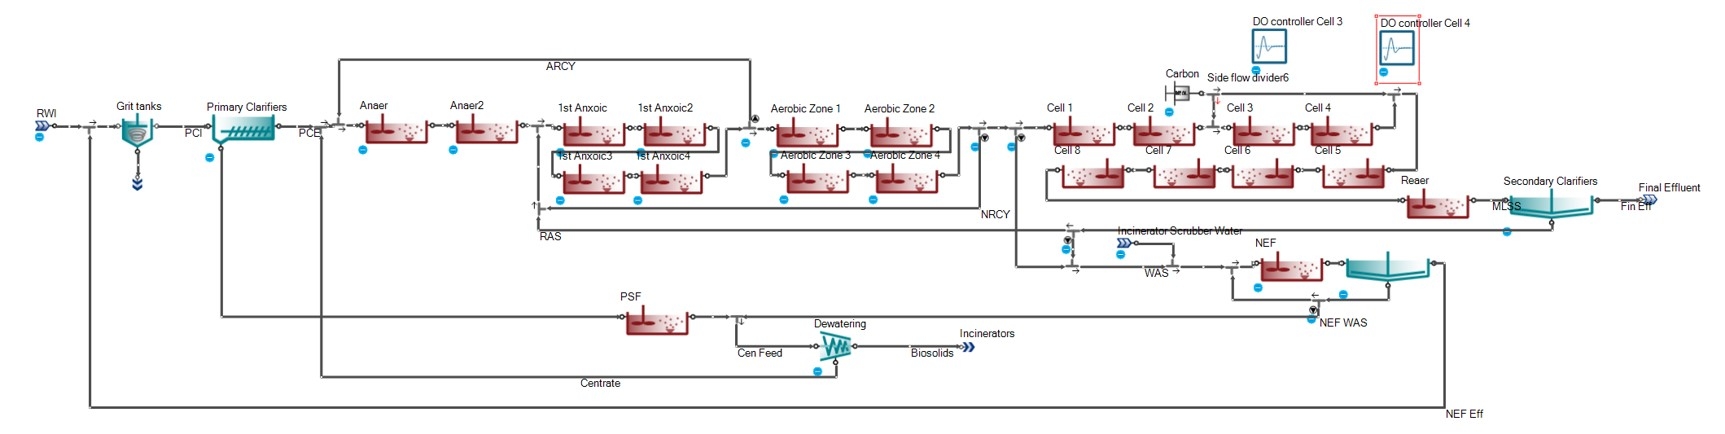
Figure 2.1. WWTP model configuration.
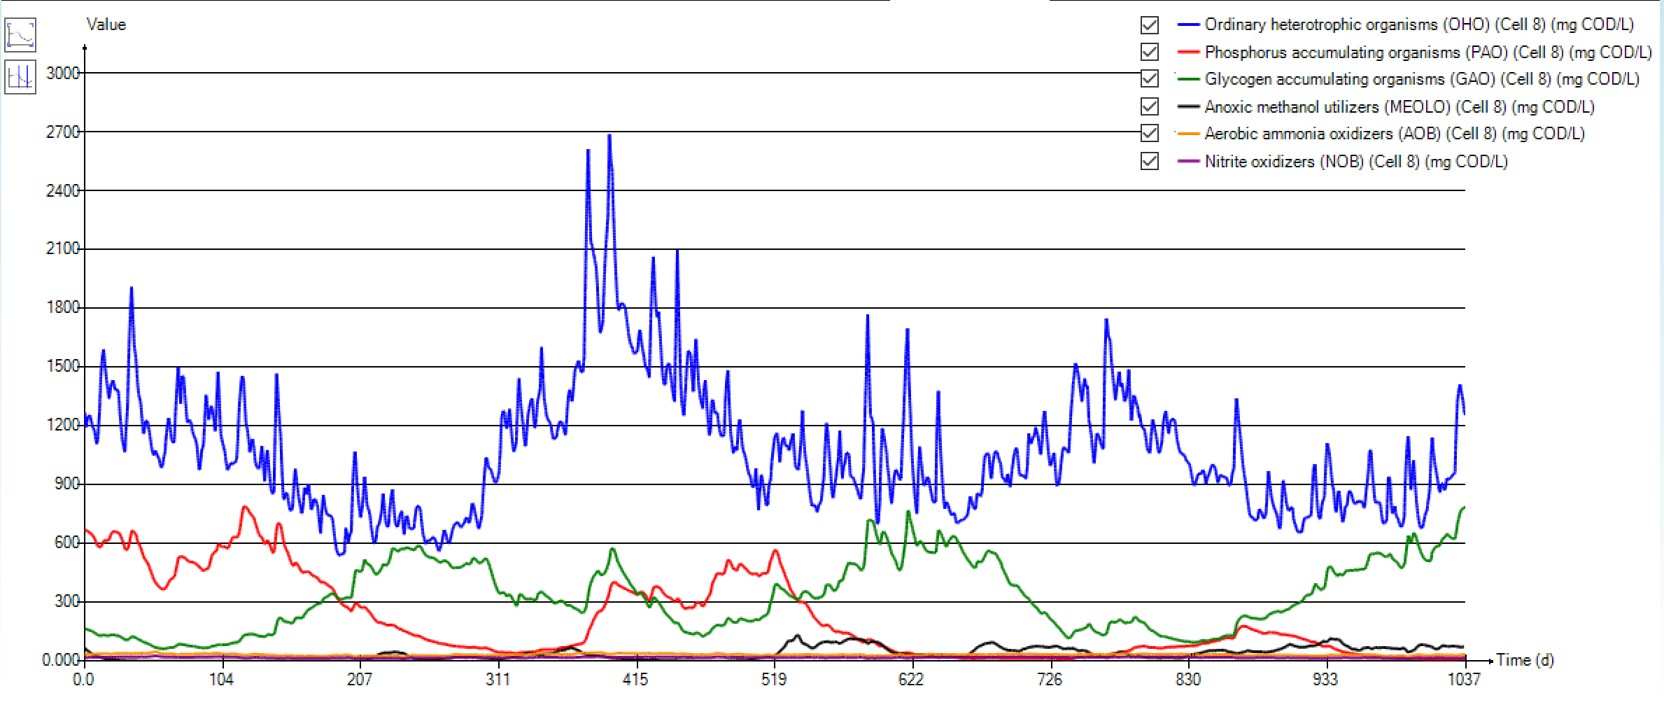
Figure 2.2. Predicted seasonal shift in PAO
and GAO population.
Project 3
Background:The objective of this project was to build
the full plant model of the WWTP and calibrate it to simulate summer and
winter average conditions. The plant is operated as a plug flow reactor
design, however prepared for step-feed operation. The main objective was to
allow the model the evaluate the different operational strategies.
Size: 50,000 m3/d, 150,000 PE
Modeling objectives and outcome:
- Evaluate plug-flow and step-feed operational
strategies
Simulate the impact on nitrification of the
step-feed strategy into the last aerated tank. The model predicted lower
MLSS in the reactor, thus it is highly likely that backmixing between
the cells at the point of feeding distributes solids more evenly along
the treatment train. This is more important when the plant operates in
plug-flow configuration. The suggested operational transition between
step-feed and plug flow can help the plant to optimize the disinfection
in terms of efficiency and cost.
- Calibrate model parameters to meet predicted effluent
ammonia
The calibrated model described the effluent ammonia
concentrations during the switch between operational modes thus allowed
the operators to fine tune the disinfection operational cost and
properly predict the required dosage.
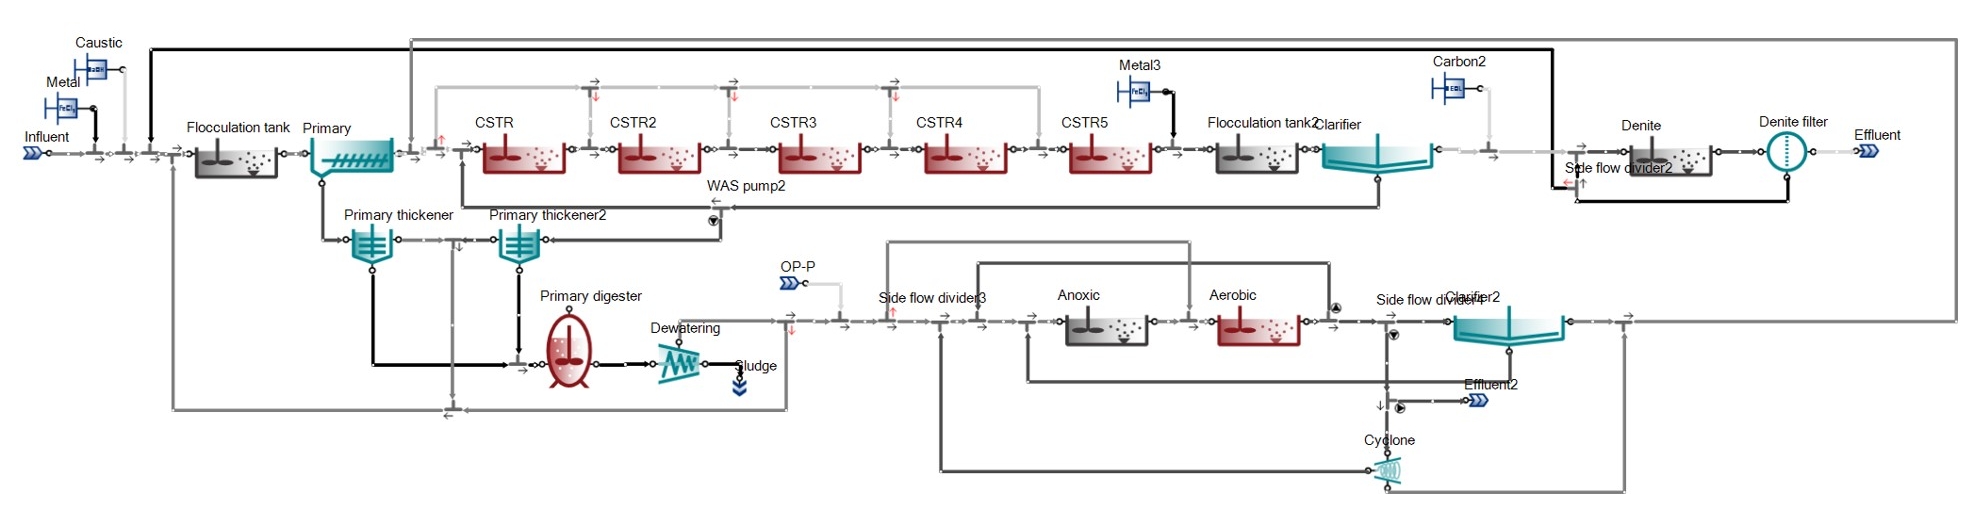
Figure 3.1. WWTP model configuration.
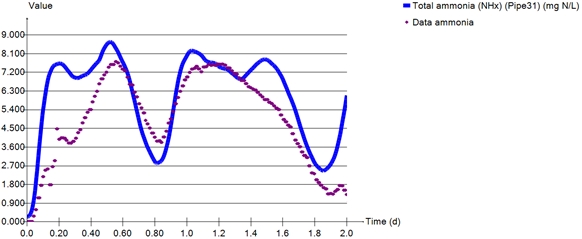
Figure 3.2. Predicted vs. measured effluent
ammonia concentrations.
Project 4
Background:The objective of this project was to build
a full plant model and calibrate it to simulate one year of dynamic
conditions.
Size: 47,000 m3/d, 200,000 PE
Modeling objectives and outcome:
- Impact of Sulphur
Based on the model results, the impact of
considering sulphur species, especially on phosphorus removal and oxygen
demand was evaluated.
- ABAC controller verification
The existing Ammonia Based
Aeration Controller was verified to work similarly in the process model
with or without the modelling of sulphur components thus allowing the
investigation of various controller settings impact on the overall plant
performance in terms of TN removal.
- IFAS unit performance overview to predict TN removal
capacity
Verify and optimize mobile carrier model with
addition of film and bulk SRT calculations, half saturations, and
activity measurements compared to data to accurately investigate
numerous aeration and recirculation strategies.
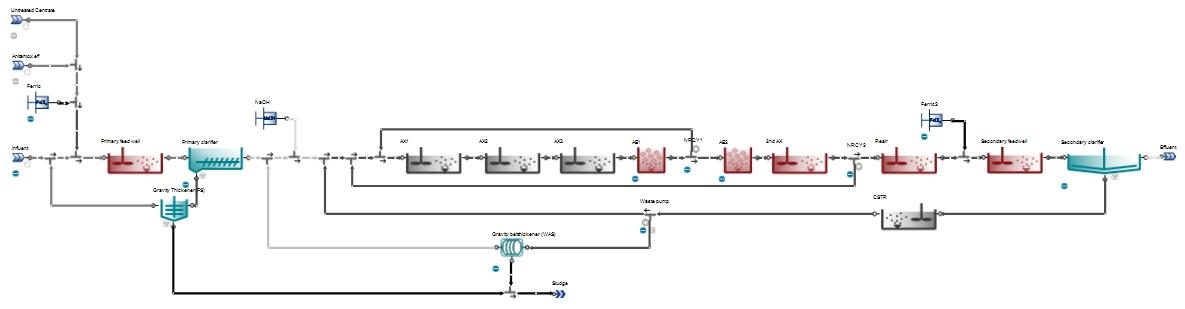
Figure 4.1. WWTP model configuration.
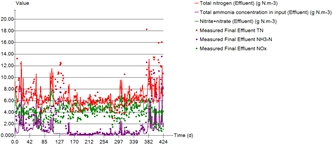
Figure 4.2. Predicted vs. measured effluent
N concentrations.
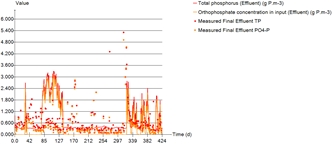
Figure 4.3. Predicted vs. measured effluent
P concentrations.
Project 5
Background:The objective of this project was to build
a full plant model and perform additional future model development to
evaluate performance of new facilities and operational strategies.
Size: 1,400,000 m3/d, 3,125,000 PE
Modeling objectives and outcome:
- Describe the impact of technology upgrade
Thermal Hydrolysis
Process model was used to evaluate digester startup and strategize
future operation. The Filtrate Treatment Facility (FTF) commissioned in
2018. The model was calibrated on data from 2016 and FTF was added to
the model as technology upgrade. The results were used to understand the
impact of FTF on the whole plant operation.
- Oxygen transfer model verification
The aeration model was
able to reproduce the average airflow rates in all the reactors, after
minor adjustments were made to the alpha factors. The calibrated alpha
factors are in the same range as measured experimentally.
- Iron dosage model verification
The iron model was verified
by reproducing TP and OP in the primary, secondary, and final effluents.
The model highlights the importance of mixing intensity at dosage points
at the plant (currently low). The model also pointed towards the role of
precipitate formation in the plant, especially in the digesters. Due to
high iron dose, significant vivianite formation is predicted by the
model.
- Investigate operational strategies
- High rate A-stage: A special model (SUMO 2C) has been
developed that can predict primary, A-stage and final effluent
colloids using an EPS based estimation.
- Partial Fe replacement by Alum: Omitting the iron dosing
and replacing it with alum evidently stops vivianite and hydrous
ferric oxide precipitation and instead Al(OH)3 and
AlPO4 are formed.
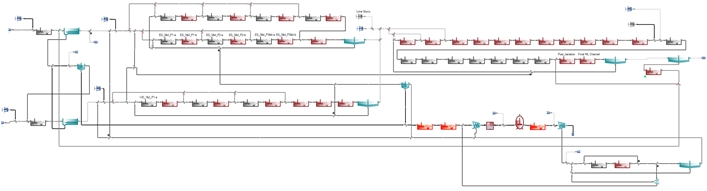
Figure 5.1. WWTP model configuration.
Project 6
Background:The objective of this project was to build
the model of two parallel treatment trains in a Water Resource Recovery
Facility and optimize operational strategy for enhanced biological
phosphorus removal (EBPR).
Size: 140,000 m3/d, 345,000 PE
Modeling objectives and outcome:
- Optimization of plant operation strategy
The configuration
of the parallel aeration basins WRRF enables plant operation both in A2O
and in Westbank side-stream EBPR modes. Modeling was used as a tool to
select operational parameters, such as determining the optimal anaerobic
detention time for RAS fermentation, in order to reach the best
performance for the observed influent scenarios and operating
conditions. The project shows a good example how utilities with flexible
infrastructure can benefit from process model application.
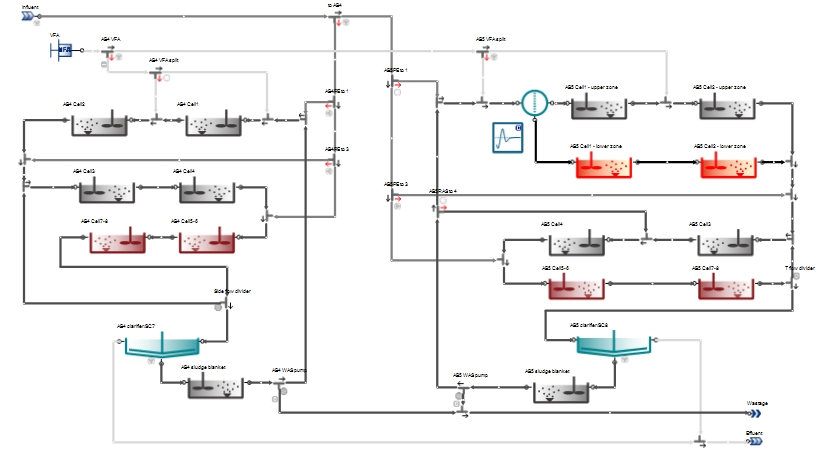
Figure 6.1. WWTP model configuration.
Project 7
Background:The objective of this project was to build
the full plant model of an advanced WWTP for operation optimization, with
the goal of reducing chemical usage and enhancing phosphorus recovery.
Size: 98,000 m3/d, 375,000 PE
Modeling objectives and outcome:
- Optimization of plant operation strategy
This plant was
among the first facilities in the United States to recover phosphorus
using the Ostara struvite recovery system, whose product is an approved,
marketable fertilizer. The purpose of modeling was to optimize plant
operation in order to reduce alum usage and increase struvite production
while maintaining good phosphorus removal rate in the liquid stream. The
project is a good example of model application where process
optimization helped to reduce operating costs and to raise revenue from
product sales.
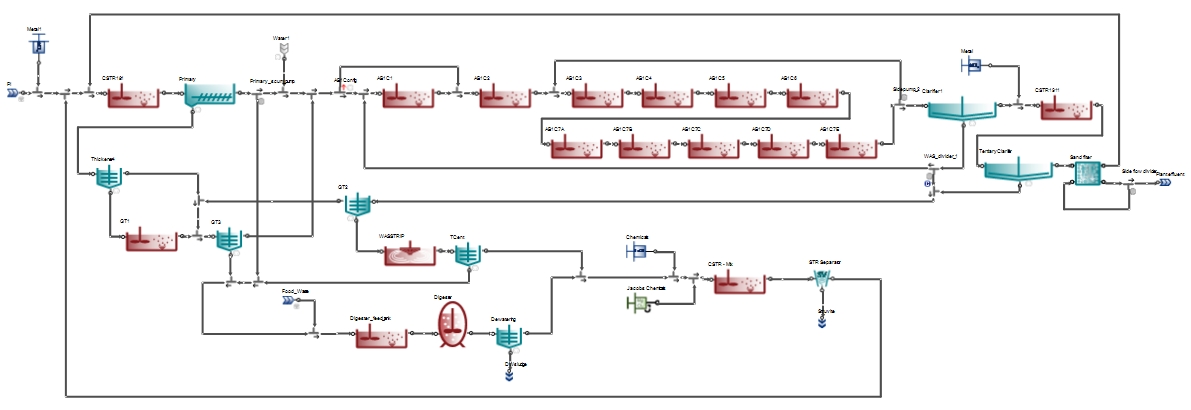
Figure 7.1. WWTP model configuration.
Project 8
Background:The objective of the project was to develop
a Digital Twin for real-time simulations and process control application of
a 5-stage Bardenpho process configuration. The plant has Ammonia-Based
Aeration Control (ABAC) implemented for achieving optimum aeration and
nitrification performance.
Size: 60,000 m3/d, 250,000 PE
Modeling objectives and outcome:
- Identifying cost-effective aeration control strategies through
real-time simulation
A fully calibrated full plant WWTP
model is linked to the Emerson Ovation’s Open Platform Communication
Unified Architecture (OPC-UA) through SUMO’s OPC-UA interface. The
Digital Twin is setup to identify the dissolved oxygen setpoints to
achieve ammonia setpoints based on a 24-hour average aerobic sludge
retention time. The data communication, simulation and identification of
setpoints are done in real-time, allowing the plant to achieve cost
effective aeration control.
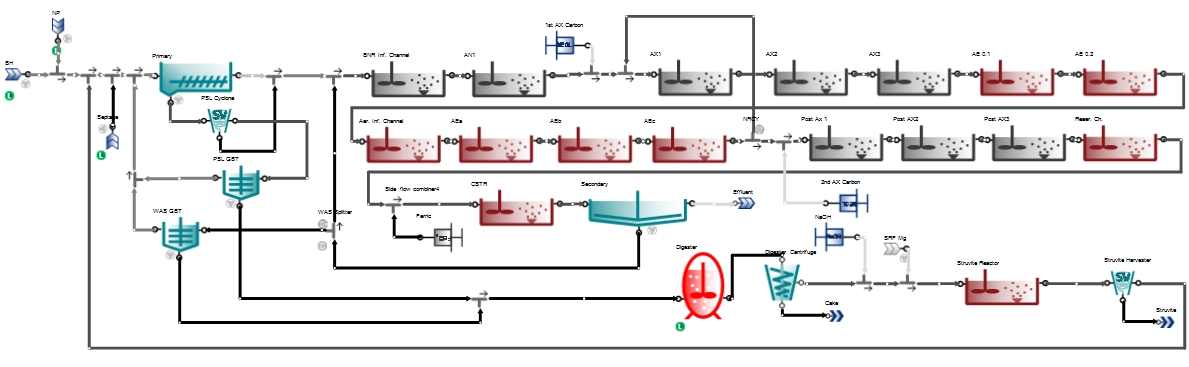
Figure 8.1. WWTP model configuration.
Project 9
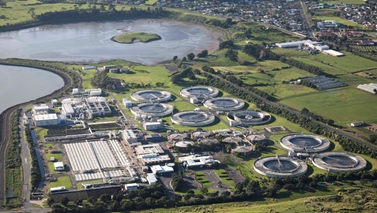
Background:The objective of this project was to build
the full plant model of an existing WWTP and perform simulations of planned
future developments in order to evaluate the performance of new facilities
and operational strategies.
Size: 350,000 m3/d, 1,950,000 PE
Modeling objectives and outcome:
- AAA: Alternating Activated Adsorption implementation
The
model version accurately represents the compact pre-treatment unit. It
integrates all features of an A-stage in a dual-tank-configuration –
biomass activation, biomass recycling, sludge wasting and waste sludge
thickening, well suited to retrofit existing primaries at a hydraulic
retention time of ca. 2 hours.
- AvN: Optimal N removal
The AvN model accurately describes
the addition of ammonia versus nitrate control logic implementation to
optimize aeration and carbon dosage.
- Implement inDENSE technology
The technology increases
process throughput and performance through the selection of dense sludge
aggregates. The model results reflect the improved settling rates and
the promotion of enhanced biological phosphorus removal (EBPR).
- CAMBI technology for the solids treatment line
The developed
thermal hydrolysis model accurately predicts the change in the solids
treatment line.
- P recovery
CalPrex and AirPrex technology was evaluated and
compared to provide information for the technology selection.
- Implement DEMON technology for sidestream treatment
The key
is the proper mathematical representation of the sequenced process to
achieve the accurate prediction of the N removal through the anammox
shortcut processes.
With these technology upgrades a modern, energy neutral resource recovery
facility can be built for the coming decades. The model provides whole plant
mass balances and enables plant-wide performance assessment, impacts of each
process addition on the whole plant and each other.
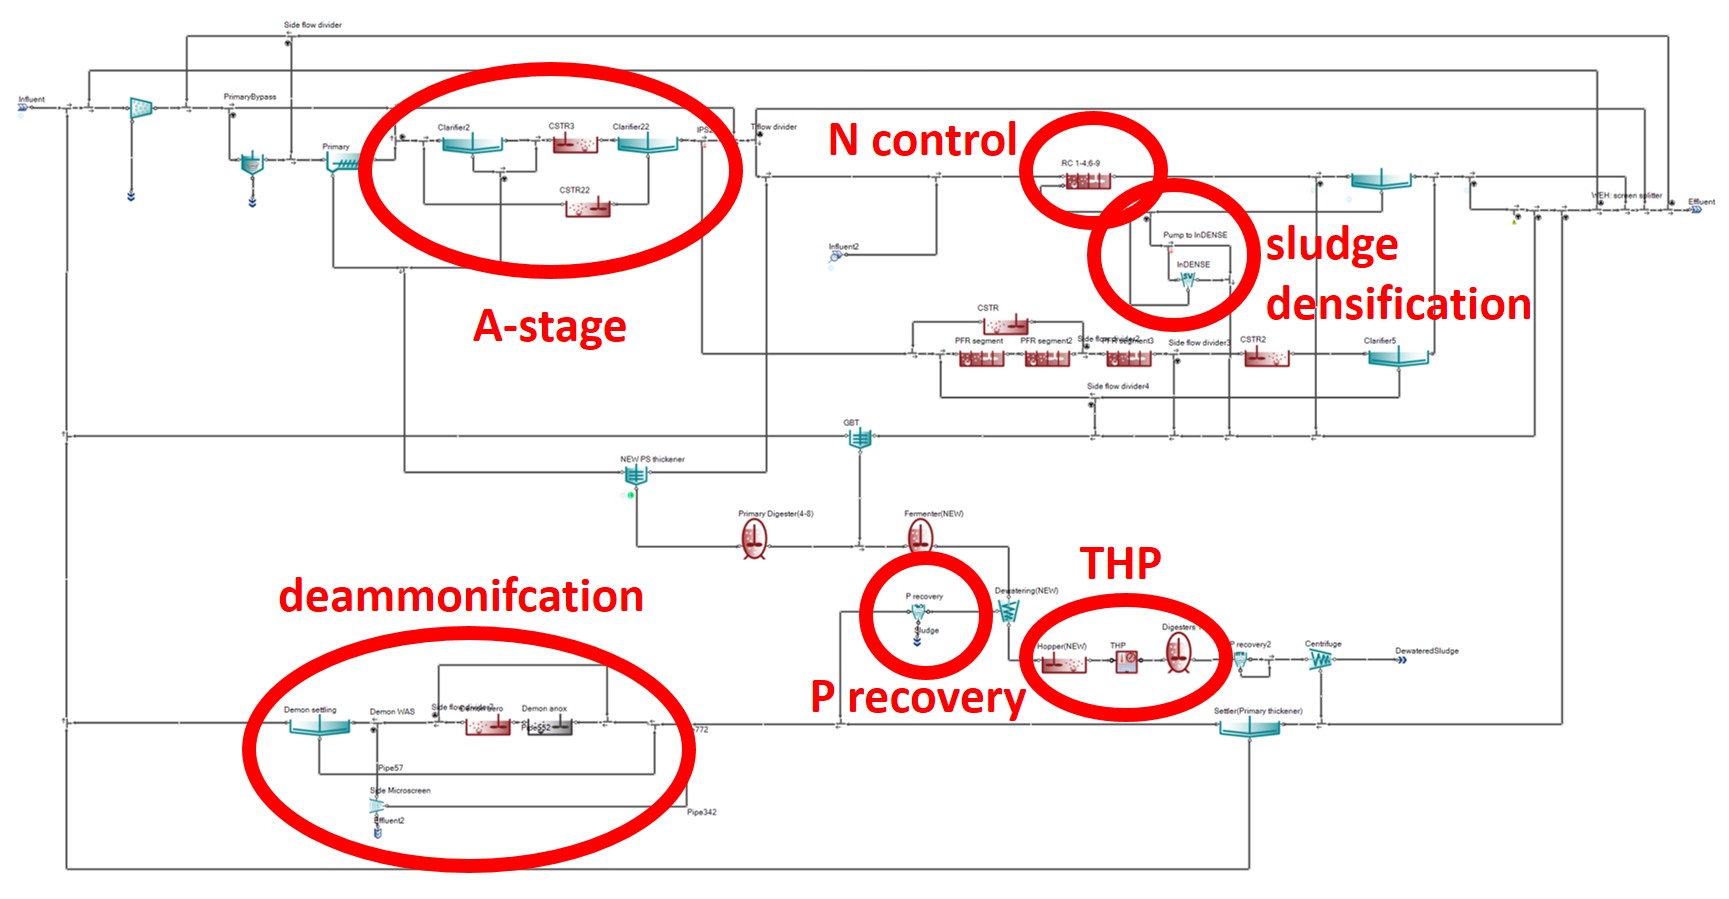
Figure 9.1. WWTP model configuration.

 for your personalized training course structure
and a quote or for more
information.
for your personalized training course structure
and a quote or for more
information.